
During a requirements meeting, a product owner once sketched a grid on the whiteboard. “I need 80 columns and 155 rows,” he said. “Make it sortable and let me export to Excel.” The rest of the room nodded. The system we were replacing was a stack of green-bar reports, so the grid felt like progress.
I asked what decision the grid would help them make. The room went quiet. After a few minutes, the real answer surfaced: they wanted to know which customer accounts were drifting toward late payments before the problem became expensive. The deliverable was not a grid. The deliverable was an early warning.
When I started in software, every screen looked like a spreadsheet.

Black backgrounds, green letters, rows of data. We opened a table, browsed records, and hunted for the information we needed. DBase, Clipper, FoxPro, early Visual Basic: they all trained us to ask for data. Even SQL, for all its expressiveness, returned a grid if you let it. That was the job then, and the tools matched the expectation.
But the expectation has moved. We now have a ladder that runs from data to information to knowledge to insight to wisdom to impact. I have written about this progression in the context of journaling in From Data to Impact: The Knowledge Cycle; the same framework is the backbone of good software design. Most users who ask for a grid are stuck at the bottom because we keep handing them spreadsheets instead of insight.
The modern system should make that climb for them.

People do not wake up wanting to scroll through transactions. They want to know if something needs their attention. I use a simple test: when a tire is low, I do not want a table of sensor pressures. I want a light on the dash that says, “Check the left rear.” The car has turned data into an answer. That is what users are really asking for when they ask for “the data.”
When a user asks for an export to Excel, the same signal is there. I wrote about this in The Spreadsheet Question: every “Can I export this to Excel?” means the application stopped one rung short. The spreadsheet becomes a workaround because the system failed to answer the question. Once they find the answer and start relying on the export to act, that answer should become a feature, not a file.
There is only one honest exception. If the person is a data scientist, give them the data. They have to make that climb themselves. For everyone else, the application should do the climbing.
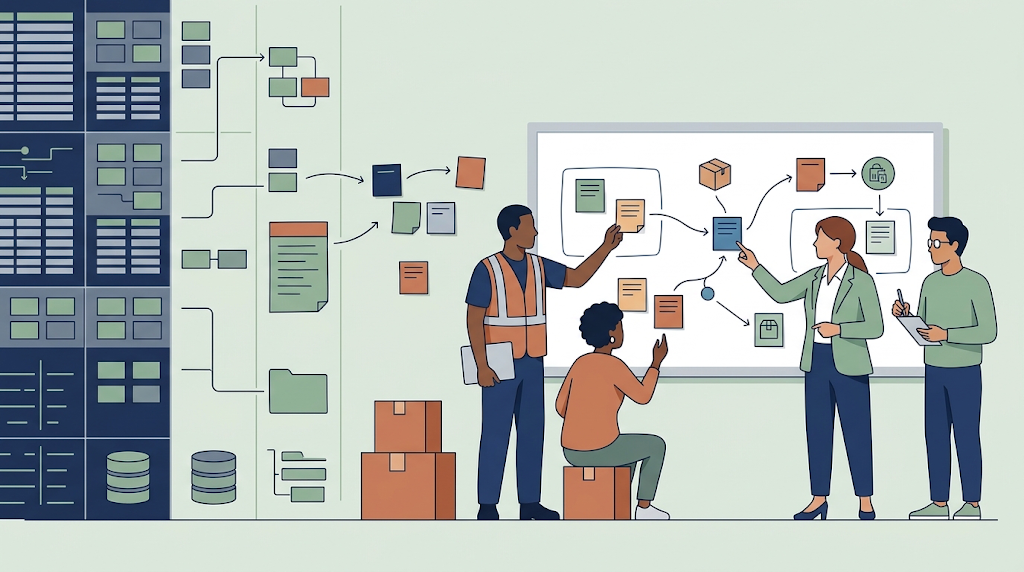
Getting there requires context. At one warehouse I visited, the workers wore gloves and sticky notes circled the monitor because the system made them pull gloves off to press tiny buttons and remember numbers while switching screens. These details are not decoration. They tell you what the person is trying to do while the data is changing. That is the user-experience side of the same problem, and it is why I believe User Experience Is Every Developer’s Responsibility. You cannot surface insight if you do not understand the situation in which it will be used.
So now, when someone asks for a grid, I ask three questions:
- What question are you trying to answer?
- What decision will you make with the answer?
- What action will you take after the decision?
If they cannot name the action, they do not need more data. They need help thinking.
This is also the difference between a dashboard and a cockpit. A dashboard shows you the world and hopes you notice what matters. A cockpit puts the warning next to the control so you can act. I explored this in Dashboard vs Cockpit, and it guides every reporting request I review.
Insight also loops back. When a system surfaces an answer, the user acts on it, learns from it, and returns with a better question. Knowledge produces insight, insight produces wisdom, and wisdom produces impact. Wisdom then feeds back into what the system should show next. If we ship only data, we break the cycle at the first step and leave the user to do the rest.
Stop shipping data. Ship answers to the questions people are actually trying to ask. That means observing context, understanding intent, and building systems that surface insight. The grid with 80 columns and 155 rows was never the product. The product was the decision it was supposed to make easier.
Surfacing the right answer is only half the work. The harder part is changing how we think about the answer, which is where the next post begins.
Further reading
- From Data to Impact: The Knowledge Cycle
- User Experience Is Every Developer’s Responsibility
- Dashboard vs Cockpit
- The Spreadsheet Question


Leave a Reply